
About the Project
The Art Institute of Chicago engaged British market research firm Morris Hargreaves McIntyre to engage in a large scale visitor research project that spanned from 2012 to 2014.
Main methods for gathering data were:
Observing visitors’ behaviors in the galleries from afar
Observing people, and then asking them a few questions about what they had just experienced
Entrance and exit surveys about visitors' expectations of the museum and whether those expectations were met
iPad Surveys
Exit Surveys
The survey was given on an iPad, and was quite long - about 10 to 15 minutes. It asked:
What visitors thought of the things they saw
What their motivations were for visiting
What else they did in their spare time
What their values and outlook on the world was
Their demographic and geographical information

An example “Culture Segment” quiz from the MHM Website with questions similar to those used in the Art Institute’s survey project.
Disregarding my bias
I made it my mission to talk to EVERYBODY regardless of my bias. Even though many people I approached:
Didn’t speak English
Were tech-phobic seniors and didn’t like using an iPad
Were students meeting friends or staff on break and weren’t visitors at all.
Were entering, not exiting
My diligence and fearlessness made me the top survey getter of the group, and was what made me stand out for hire in the Public Affairs department and continuation on the research team.

Following People's Paths

Modern Wing Signage
In the Modern Wing, the designers envisioned that people would use the elevator to start their journey on the third floor and work their way down.
People walked up the staircase instead. If they stopped on the second floor, they would see art from after 1950 before the art from the early 1900s - the opposite order than the curators intended.
Also, people entered the door closest to the stairs instead of closest to the elevator which would lead them through the galleries in reverse chronological order.
The research tested if signage could fix these problems so the art wouldn’t have to be rehung - an expensive and delicate process.
Intro paragraphs and a timeline were created to give people historical context to what they were about to see.
A simple EXIT sign was put on one door to encourage visitors to walk through the galleries in the right order.

Accessing Engament
In-Gallery Observations
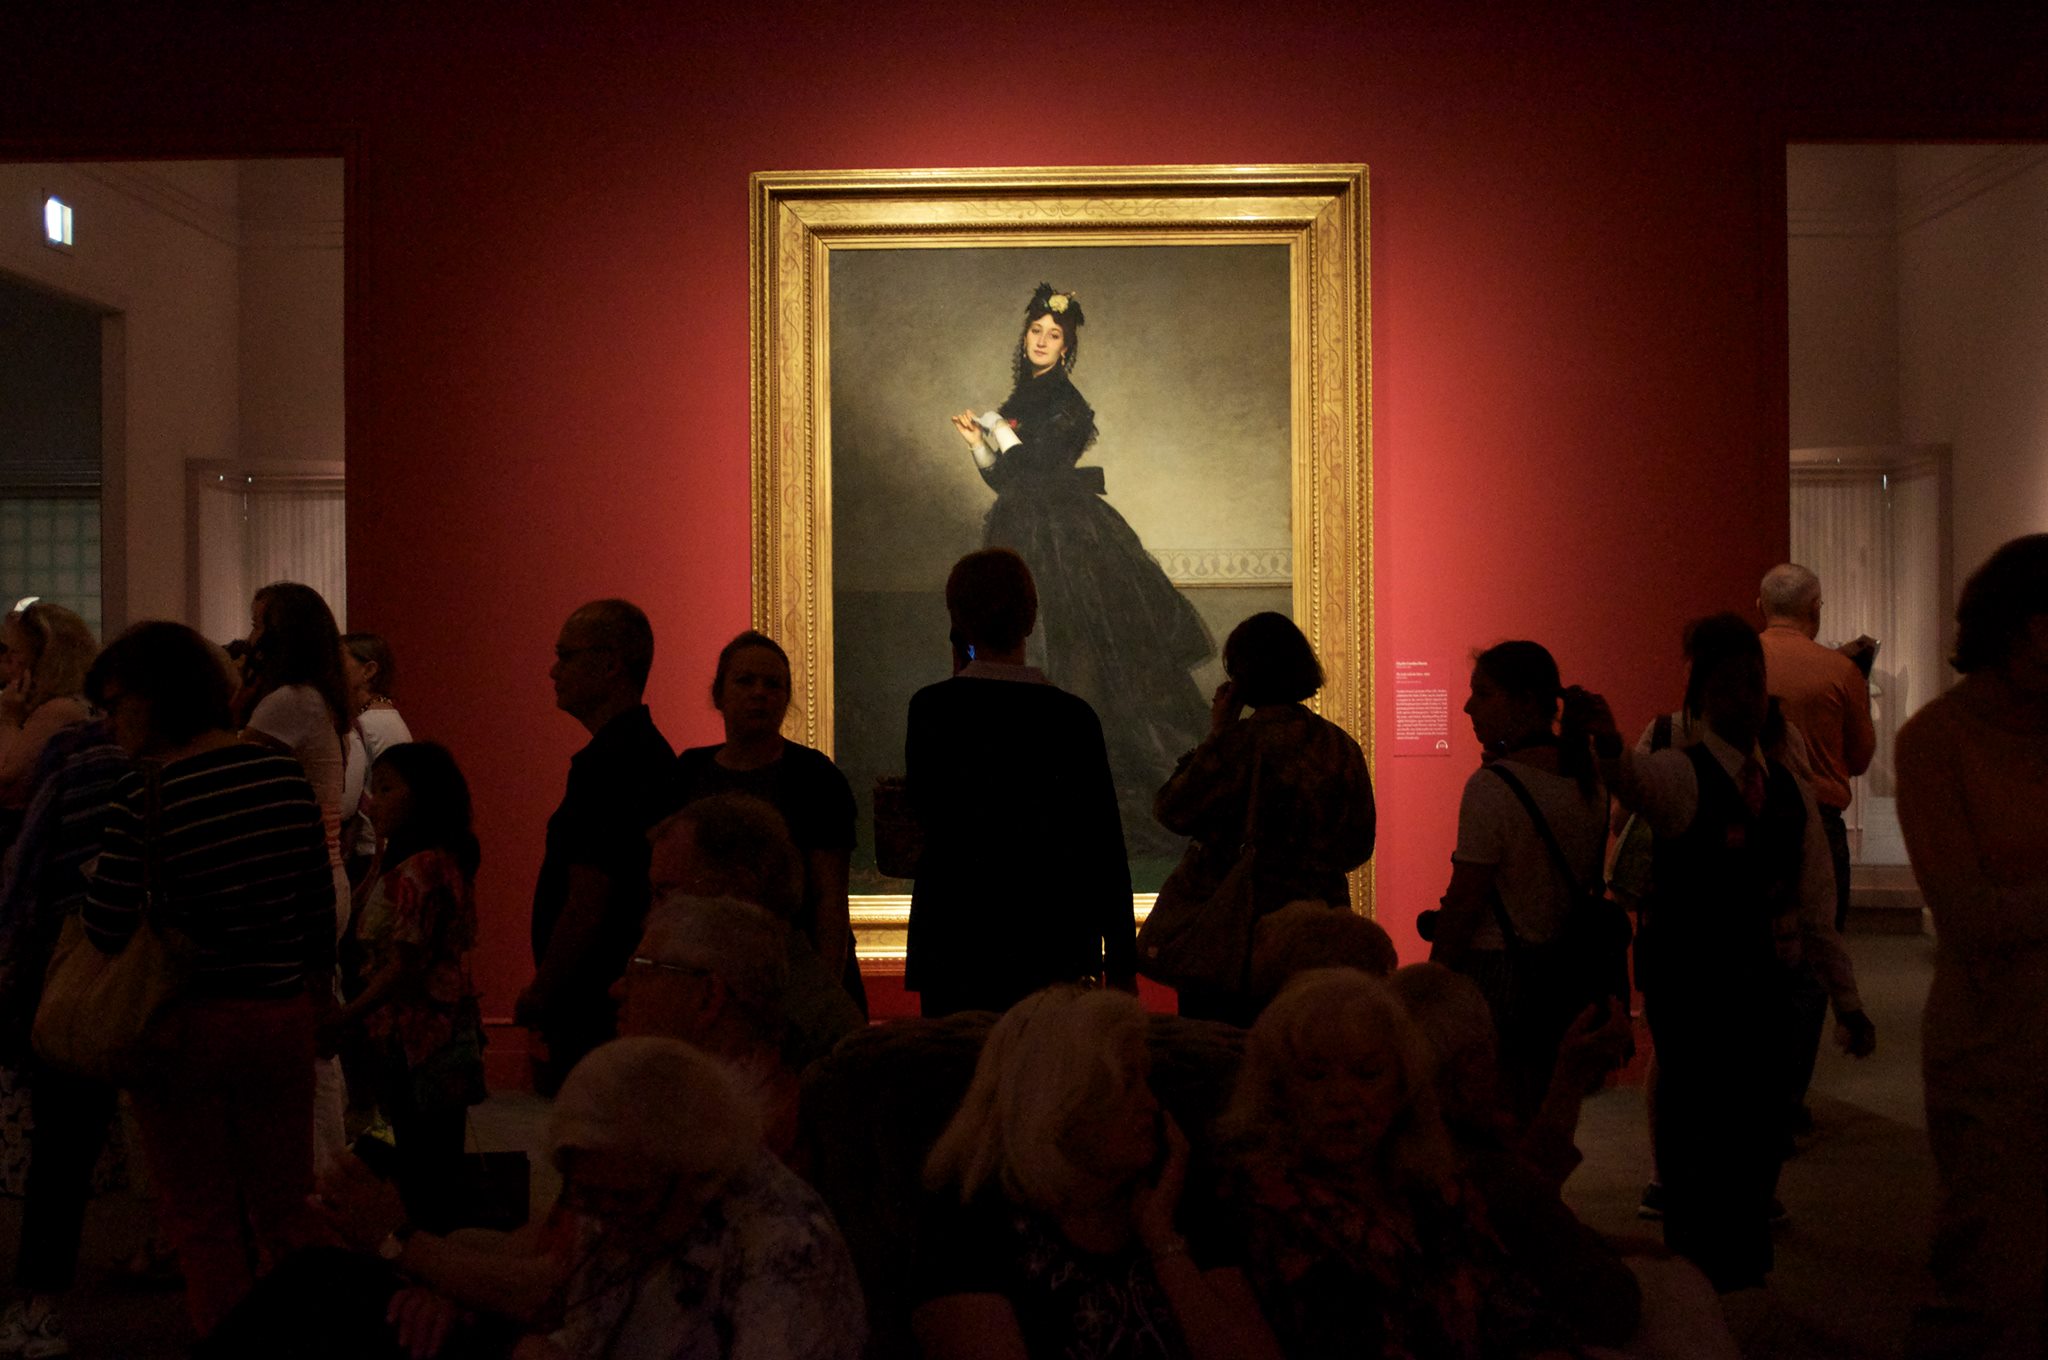
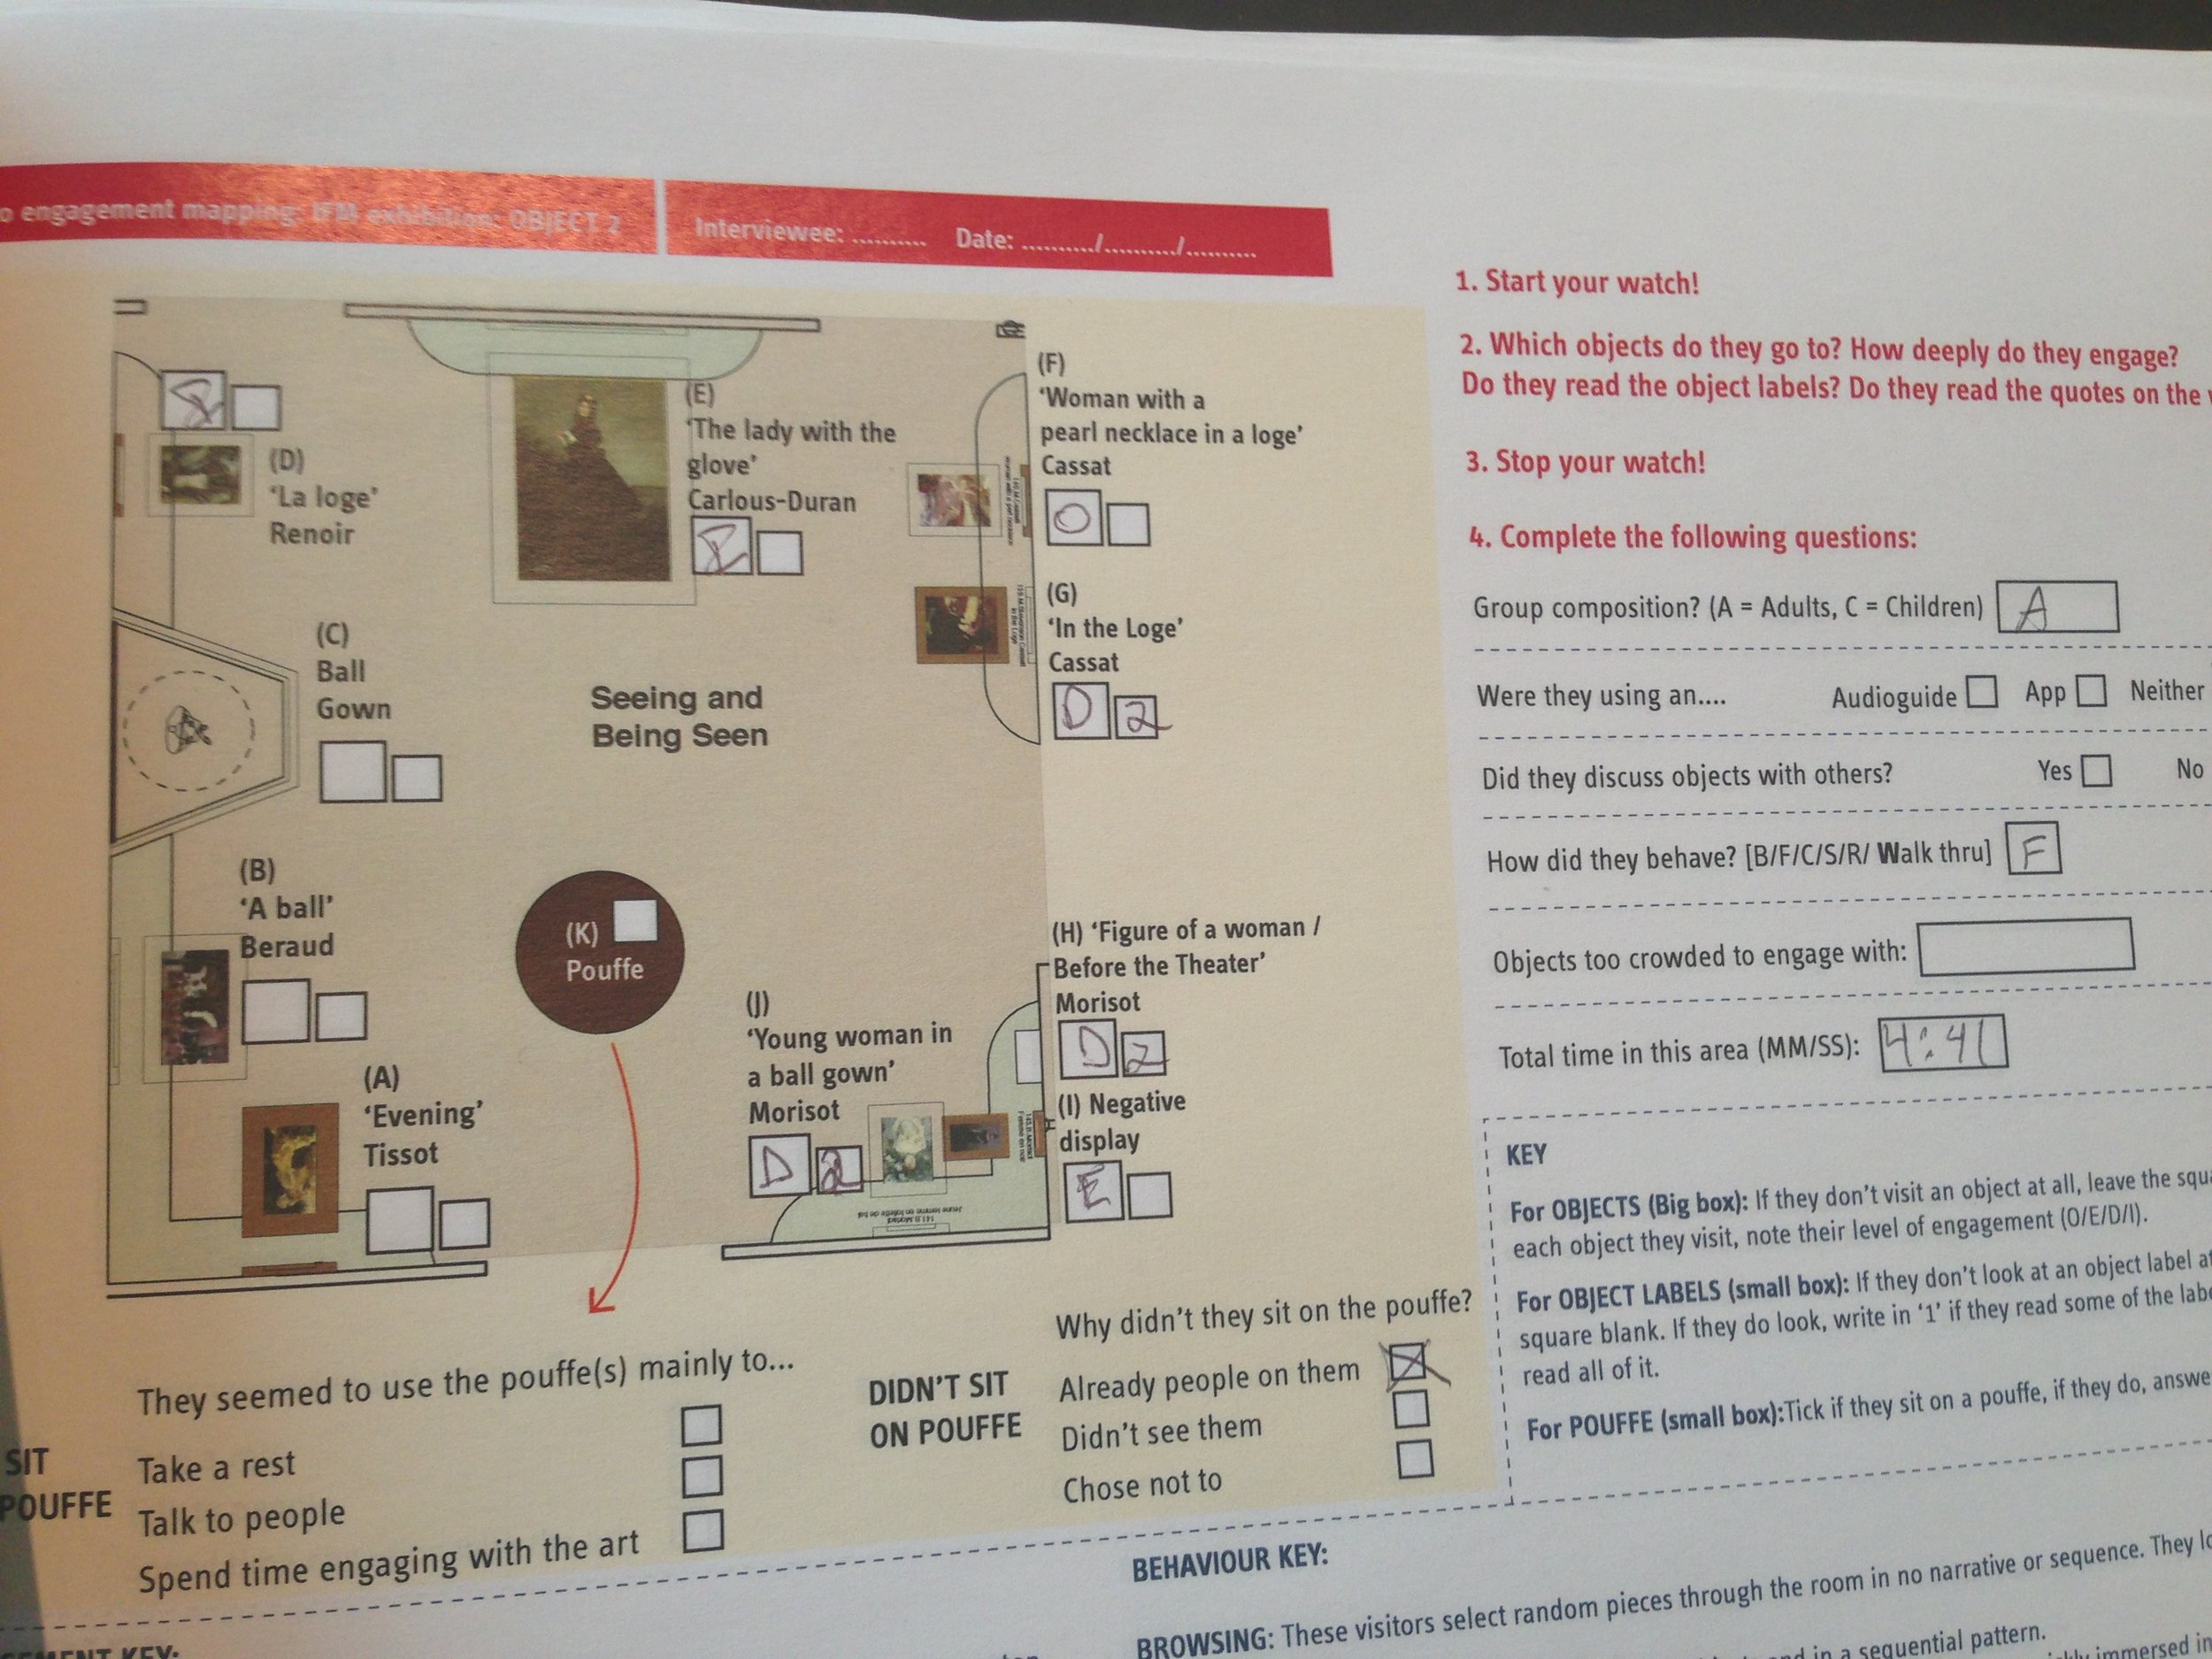
In some permanent collection galleries and the summer special exhibition we would observe visitors engage with works of art.
Using a stopwatch, we would time how long people walked around, spent in each room, looked at each object, sat down, ect.
We also noted their level of engagement with wall text and artwork.
Were they browsing, walking around and only stopping at a few things?
Were they searching for something specific to look at?
Did they try to look at every single work of art and read each label before leaving the room?
For some of these observations, I would follow visitors to the next room and ask them some questions to self report their experience.
People generally thought they spent longer in each space and read more information than they actually had.
"Rouge" Research Phase
Testing small hypotheses
After we were done with the large research project, senior leadership still had initiatives that they wanted to test.
We could test small changes - like the placement of a single sign, or the color of a display.
I was the lone data collector for these outings, and each day I would be given a new task and collect data for 4 hour stretches.

The “hallway” Effect
A main focus was the challenging “hallway” effect of the Modern Wing.
People would walk straight through and exit the Modern Wing without stopping to engage with exhibitions there.
Past strategies such as putting artwork in the center of the room hadn’t made a difference (and were very expensive to move for events).
We did an entire phase of research watching people enter and exit the modern wing to track their path.

Mobile Info Desk
We decided to try a “mobile info desk” with volunteers in the center of the room.
Could a human presence influence people to stop and observe their surroundings and plan their trip more thoughtfully?
What were people actually interested in seeing? We could now talk to them and find out.
We discovered that usually people were not planning on starting their journey in the Modern Wing, but they entered there by coincidence or because the line was shorter than the other entrance.
Having a human presence did aid in way-finding and visitor satisfaction, but didn’t on the whole, make more people stop in the hallway.
Instagram Tracker

What Were People Looking At?
The Mobile Info Desk made us more curious about what people were actually looking at.
What were the most popular works of art in the collection?
Did people come primarily to see special exhibitions? Did they come to see the top hits?
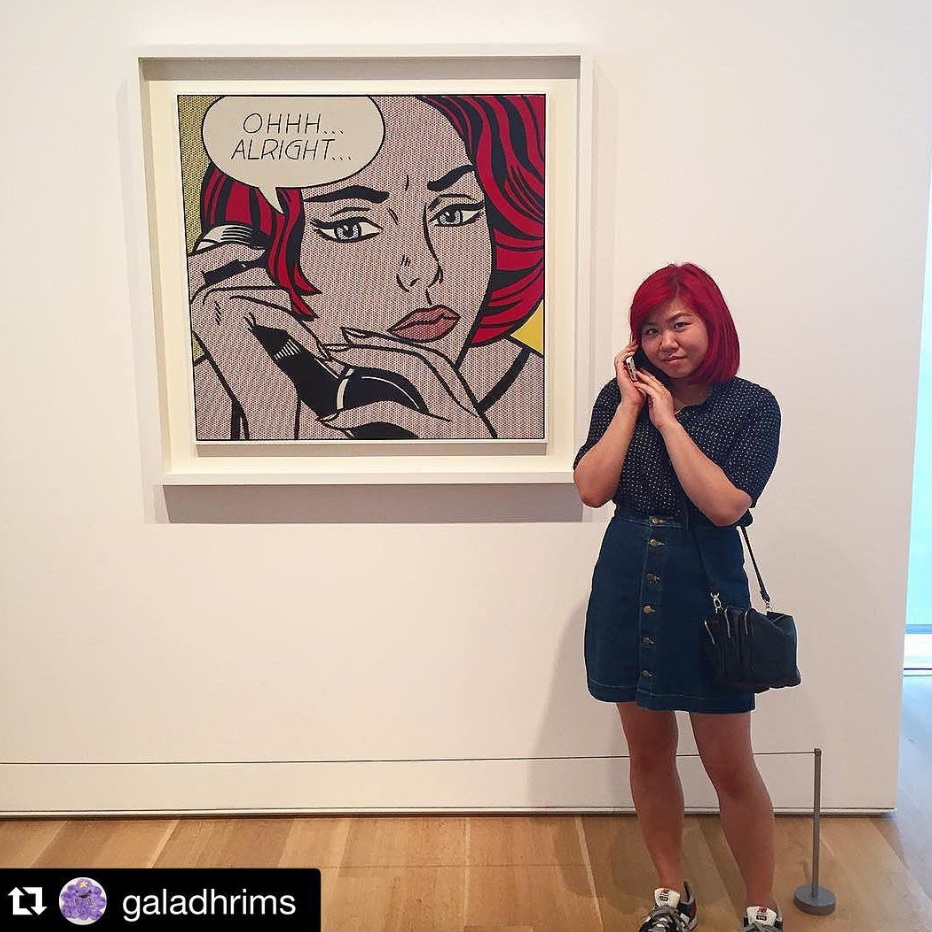
Were people engaging and having fun? What art was “selfie-bait”?

Creating an Automated Trigger
Tracking Instagram By Location
I created a trigger using the web-based application “If This, Then That” to add a row to a spreadsheet whenever anyone posted an instagram within the GPS coordinates of the museum.
This went beyond simply pictures that were TAGGED with a location on Instagram. The spreadsheet could capture any pictures simply posted within the boundaries of the museum.
It is actually no longer possible to set up this formula. Now, you can only create a trigger for your personal Instagram account.


Connecting on social media
Not only did the Instagram tracking spreadsheet also allowed the Art Institute to engage more effectively on social media, and share images taken by patrons.

The Basis for a Future App
At the time of this project in 2014/2015, GPS wasn’t sensitive enough to actually track people’s path through the museum, gallery by gallery, but that was the ultimate goal.
Tracking where visitors would go first, next, and last could ultimately help the curatorial team be better able to present an informative journey through the history of art.
Not long after I left the institution, the museum debuted a brand new app featuring guided tours with a GPS feature sensitive enough to give directions to specific rooms.

Explore the Map
Orient yourself in the galleries and discover nearby artworks with the location-aware interactive map. Find familiar works or uncover new favorites while you explore the museum. The mobile map lets you peruse the galleries anytime, anywhere.
